Business Dashboard Builder
Do You Actually Know How Your Business Is Performing Right Now?
Most small business owners have a rough sense of how things are going. Revenue feels up or down. Cash feels tight or comfortable. The team feels stretched or okay. But a rough sense is not the same as clear visibility, and flying blind is one of the most common reasons businesses stall, overspend, or miss opportunities they did not even know were there.
The Chase Hunt Business Dashboard Builder is a free tool that changes that. In under five minutes, you enter your core numbers, and the tool gives you a scored, benchmarked dashboard showing exactly how your business is performing across four critical dimensions:
- Revenue and profit,
- Cash position,
- Sales activity, and
- People productivity.
What the Tool Measures
The dashboard is built around the four areas that determine the financial health and growth potential of any small or medium business, regardless of industry.
Revenue and Profit
The tool calculates your gross margin, net margin, and revenue versus target. Each one is benchmarked against healthy ranges for your specific type of business. A service business has different margin expectations than a retail operation or a hospitality venue, so the benchmarks adjust accordingly.
Cash Position
Cash runway tells you how many months you could operate if revenue stopped tomorrow. Debtor days tells you how long it takes your clients to pay you. Together, these two metrics tell you more about the health of your business than your profit figure alone.
Sales Activity
This section adapts to your business type. Service and trade businesses see their pipeline and quote coverage. Retail businesses see transaction volume and average spend. Hospitality venues see covers and spend per head. The question being answered is the same for every business type: Do you have enough activity in front of you to hit your revenue target next month?
People
Productivity tells you whether the people in your business are generating a return relative to what they cost. For sole traders, the tool measures owner earnings and effective hourly rate. For small teams, wage cost as a percentage of revenue is benchmarked against ranges appropriate for your team size and industry. For larger teams, industry-standard benchmarks apply.
How to Use the Tool
The tool takes five steps and around five minutes to complete.
Step 1 — Select your business type. Choose from six categories: Service/Professional, Trade/Labour, Retail, Hospitality/Food, Manufacturing/Product, or SaaS/Subscription. This selection calibrates every benchmark and score in your result.
Step 2 — Enter your revenue and profit figures. Use your most recent month's actual numbers. If you prefer to work with annual figures, divide by twelve. You will need your monthly revenue (actual and target), cost of goods or delivery, and fixed monthly overheads.
Step 3 — Enter your cash position. Your current bank balance, total debtors outstanding, and average debtor days. Monthly expenses are calculated automatically from the figures you entered in Step 2 — no double entry required.
Step 4 — Enter your sales activity figures. The fields here depend on your business type. Service businesses enter active leads, average project value, and close rate. Retail businesses enter weekly transactions, average transaction value, and their weekly target. Hospitality venues enter weekly covers, average spend per head, and venue capacity.
Step 5 — Enter your people figures. Total headcount (including yourself) and total monthly wage cost.
Your dashboard is then generated automatically.
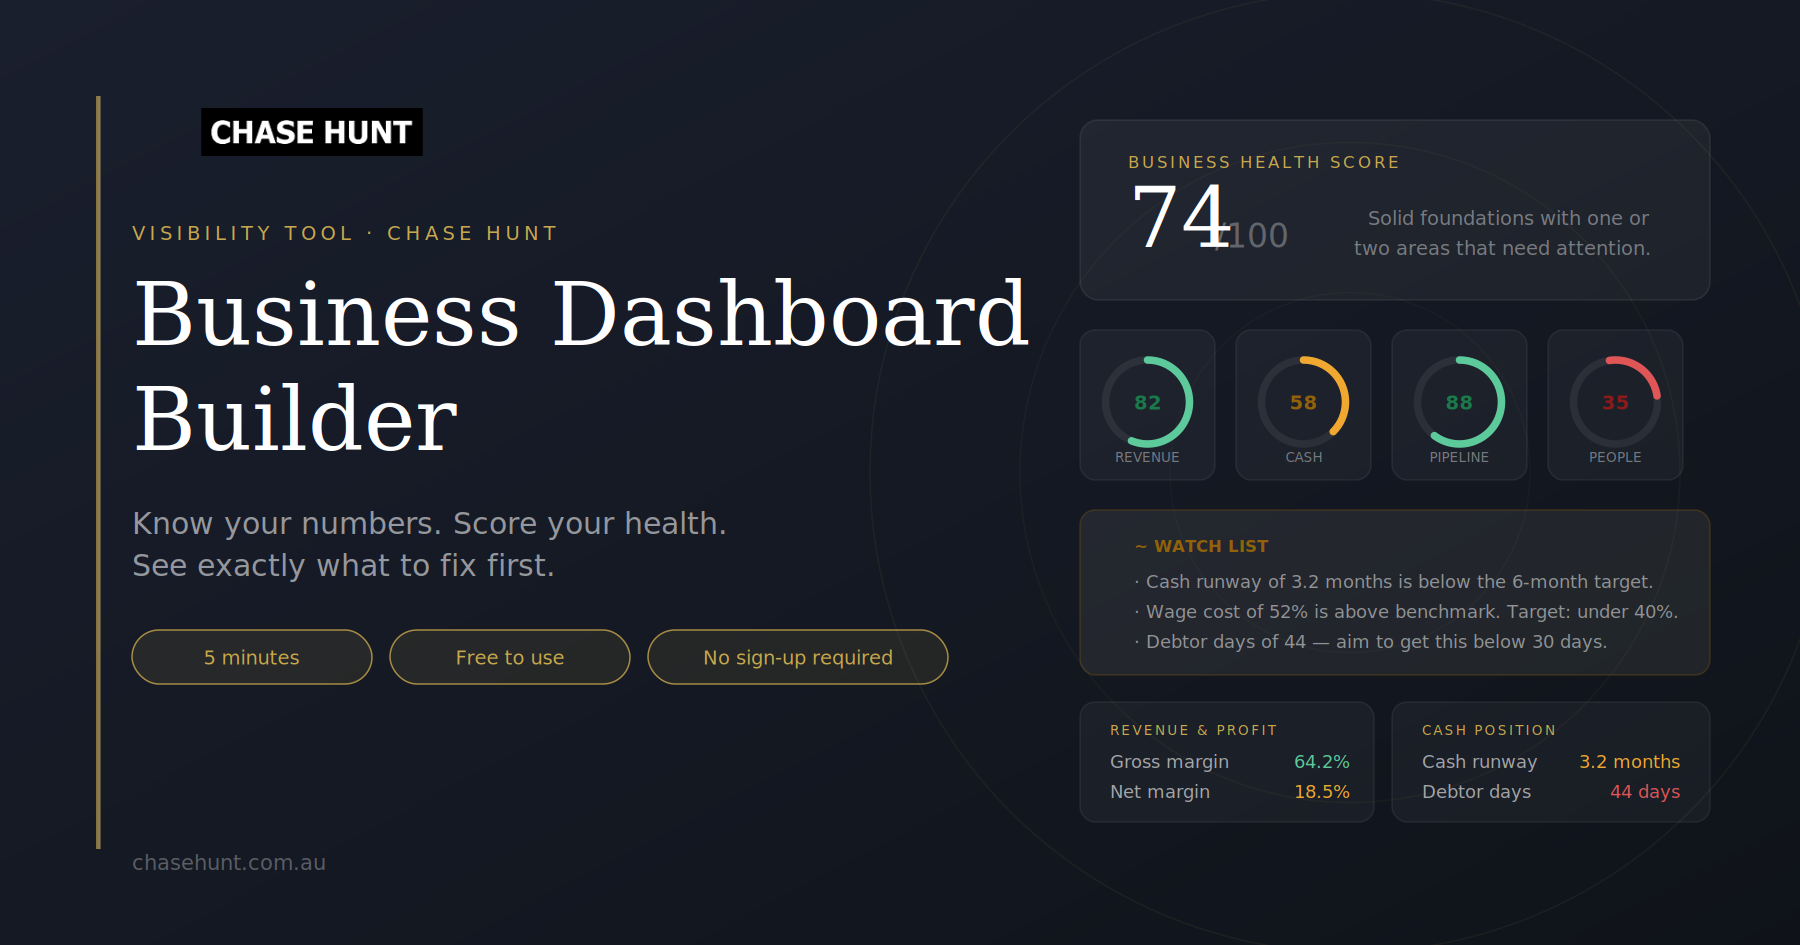
What You Get
The dashboard gives you a Business Health Score out of 100, four individual dimension scores, and a Watch List that flags the one to three metrics most in need of your attention. This is provided with specific, plain-language observations about what the number is telling you and what to do about it.
Every benchmarked metric shows both your actual figure and the target you are aiming for, so you always know exactly what good looks like for your type and size of business.
A benchmark bar chart at the bottom of the dashboard shows how your key metrics compare visually to the targets for your industry, making it easy to see at a glance where your biggest gaps are.
The dashboard is designed to be updated monthly. Tracking your Business Health Score over time gives you a clear picture of whether the business is improving and where to focus your energy in any given month.
The Limitations of the Tool
The Business Dashboard Builder is a starting point, not a substitute for proper financial management or professional advice.
The benchmarks are indicative. The ranges used to score your metrics are built around general patterns across business types. Your specific circumstances (your market, your business model, your growth stage, your cost structure) may mean that the benchmarks do not perfectly reflect what healthy looks like for your particular business. A high-growth SaaS company burning cash intentionally will score differently than a profitable lifestyle business, even if both are making excellent decisions.
The metrics are only as good as the numbers you enter. The tool cannot verify your figures, account for seasonal variation, or factor in one-off events that distort a single month's performance. A month with an unusually large project or an unexpected expense will skew the result. For a more accurate picture, consider using averages across three months rather than a single month's snapshot.
Not every measure that matters to your business is included. The tool covers four core dimensions, but depending on your industry and business model, there may be critical metrics that are specific to your situation (customer retention rates, inventory turnover, occupancy rates, utilisation percentages, net promoter scores, or any number of other indicators that the tool does not currently capture).
This is not financial advice. The tool is designed to help you see your business more clearly. For decisions involving significant financial risk, pricing strategy, funding, or restructuring, please work with a qualified adviser.
Where the Tool Ends and the Real Work Begins
The most common response I hear after someone completes the dashboard is some version of: "I knew things weren't quite right, but I didn't realise it was this."
Seeing your numbers scored and benchmarked is genuinely useful. But knowing what to do about a 58/100 cash health score, or a 2.1x pipeline coverage ratio, or a gross margin that is eight points below the benchmark is where the conversation gets interesting.
Chase Hunt works with small business owners who have a clear picture of where their business is, a sense of where it needs to go, and not enough time or headspace to close the gap on their own. If that sounds familiar, the dashboard is a good place to start.
Frequently Asked Questions
- Is the Business Dashboard Builder really free? Yes. No sign-up, no email required, no payment. Enter your numbers and get your dashboard.
- How often should I use it? Monthly is the recommended cadence. Your Business Health Score is most useful as a trend over time — a single snapshot tells you where you are, but tracking it month to month tells you whether you are moving in the right direction.
- What if I am a sole trader? The tool handles sole traders specifically. The people section switches from wage cost percentage to owner earnings percentage and effective hourly rate — metrics that are far more meaningful when you are the business.
- What business types does it cover? Service/Professional, Trade/Labour, Retail, Hospitality/Food, Manufacturing/Product, and SaaS/Subscription. Each has its own benchmarks and industry-appropriate terminology throughout the tool.
- Can I save my results? The tool does not store your data. To keep a record of your dashboard, use the Print/Save as PDF button at the top of your results page. This lets you save or print a clean version of your dashboard for your records.
- My numbers look worse than I expected. What should I do? Start with the Watch List. It identifies the one to three metrics with the most immediate impact and tells you specifically what the number is telling you. Then book a call — that is exactly the conversation Chase Hunt is built for.
The Chase Hunt Business Dashboard Builder is part of the Chase Hunt Business Operating System — a suite of free tools designed to help small business owners build, grow, and run their businesses with more clarity and less chaos. Other tools in the suite include the Owner Type Indicator and the Chase Hunt Business Planner.